XRP/USD – Bulls Fight To Reclaim $1
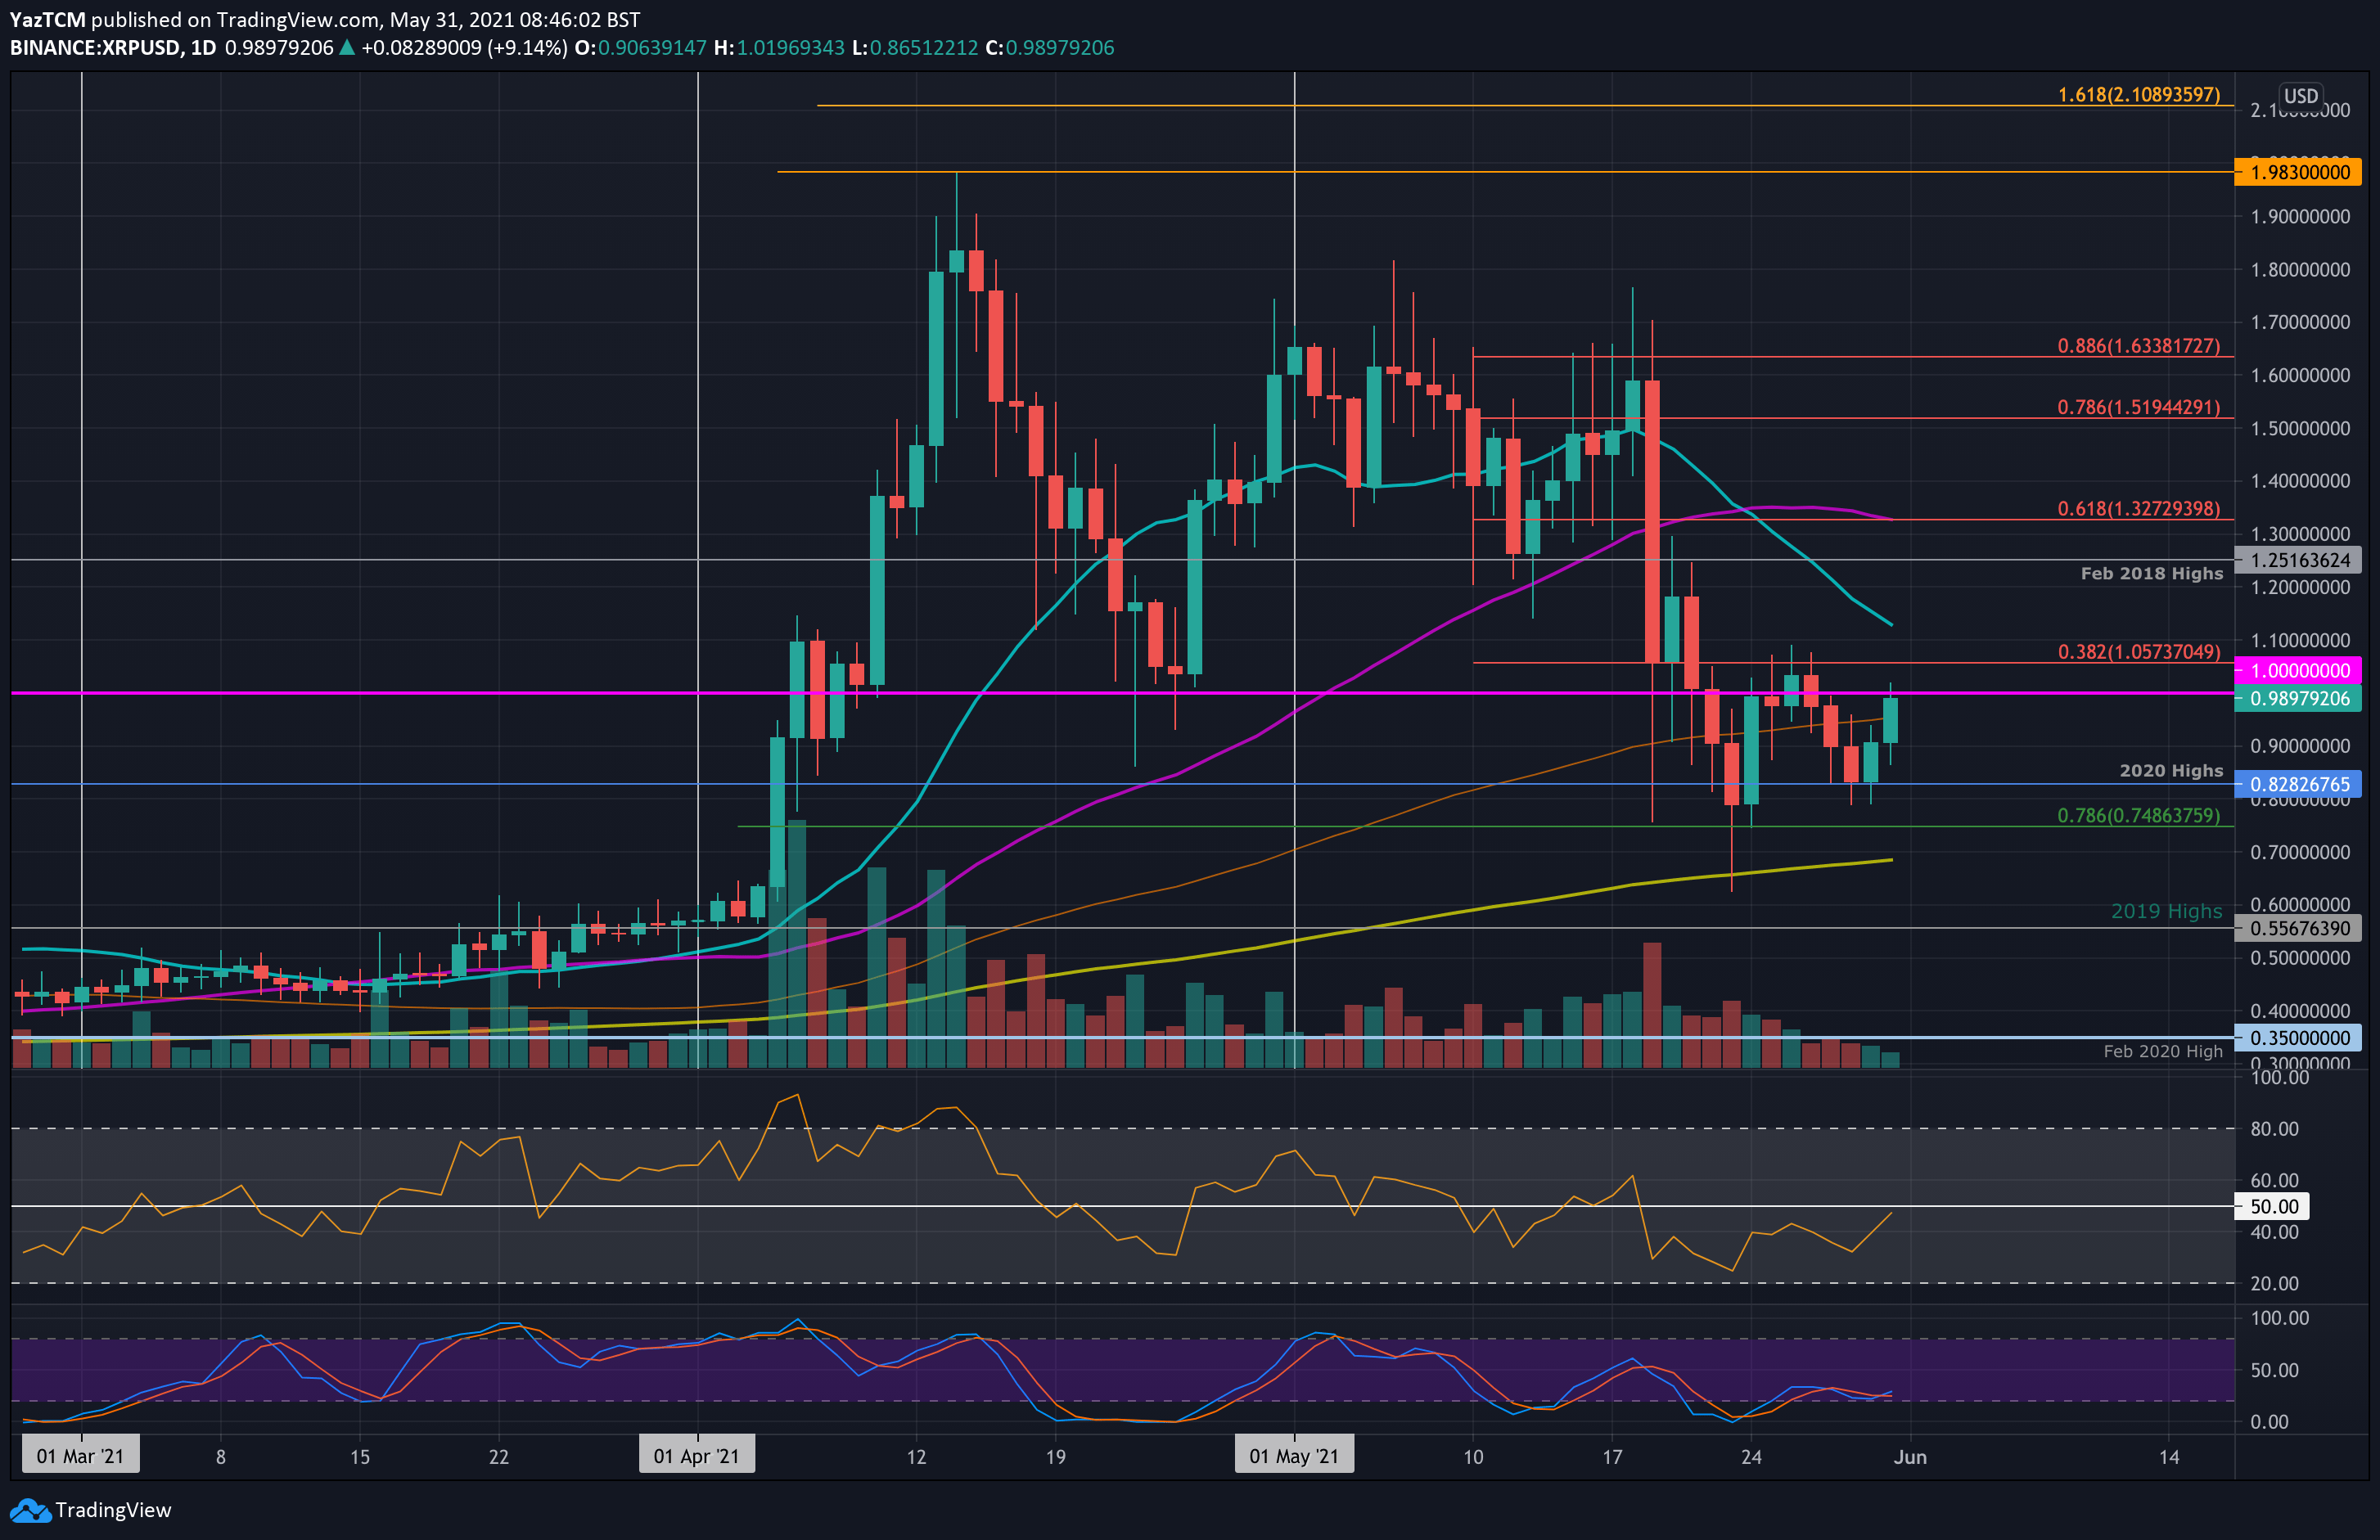
Key Support Levels: $0.9, $0.8282, $0.75.
Key Resistance Levels: $1.05, $1.12, $1.25.
XRP surged by a strong 14% today as the bulls battle to reclaim the $1 level. The coin fell beneath the level toward the end of last week and started to head lower over the weekend as it slipped beneath the 100-day MA at $0.95.
The cryptocurrency continued to fall until support was found at $0.8282 on Saturday. The market closed at this support and rebounded from there yesterday to climb back above $0.9. Today, the 13% surge allowed XRP to climb above the 100-day MA again as it looks to reclaim $1 next.

XRP-USD Short Term Price Prediction
Looking ahead, if the bulls break $1, the first resistance lies at $1.05 (beraish .382 Fib). This is followed by $1.12 (20-day MA), $1.25 (Feb 2018 highs), and $1.33 (bearish .618 Fib & 50-day MA).
On the other side, the first support lies at $0.9. This is followed by $0.8282, $0.75 (.786 Fib), and $0.69 (200-day MA).
The RSI has returned to the midline to indicate indecision within the market. For XRP to reclaim $1.00 and remain above it, the RSI would need to break above 50 to indicate bullish momentum within the market.
XRP/BTC – Bulls Break Last Week’s Resistance
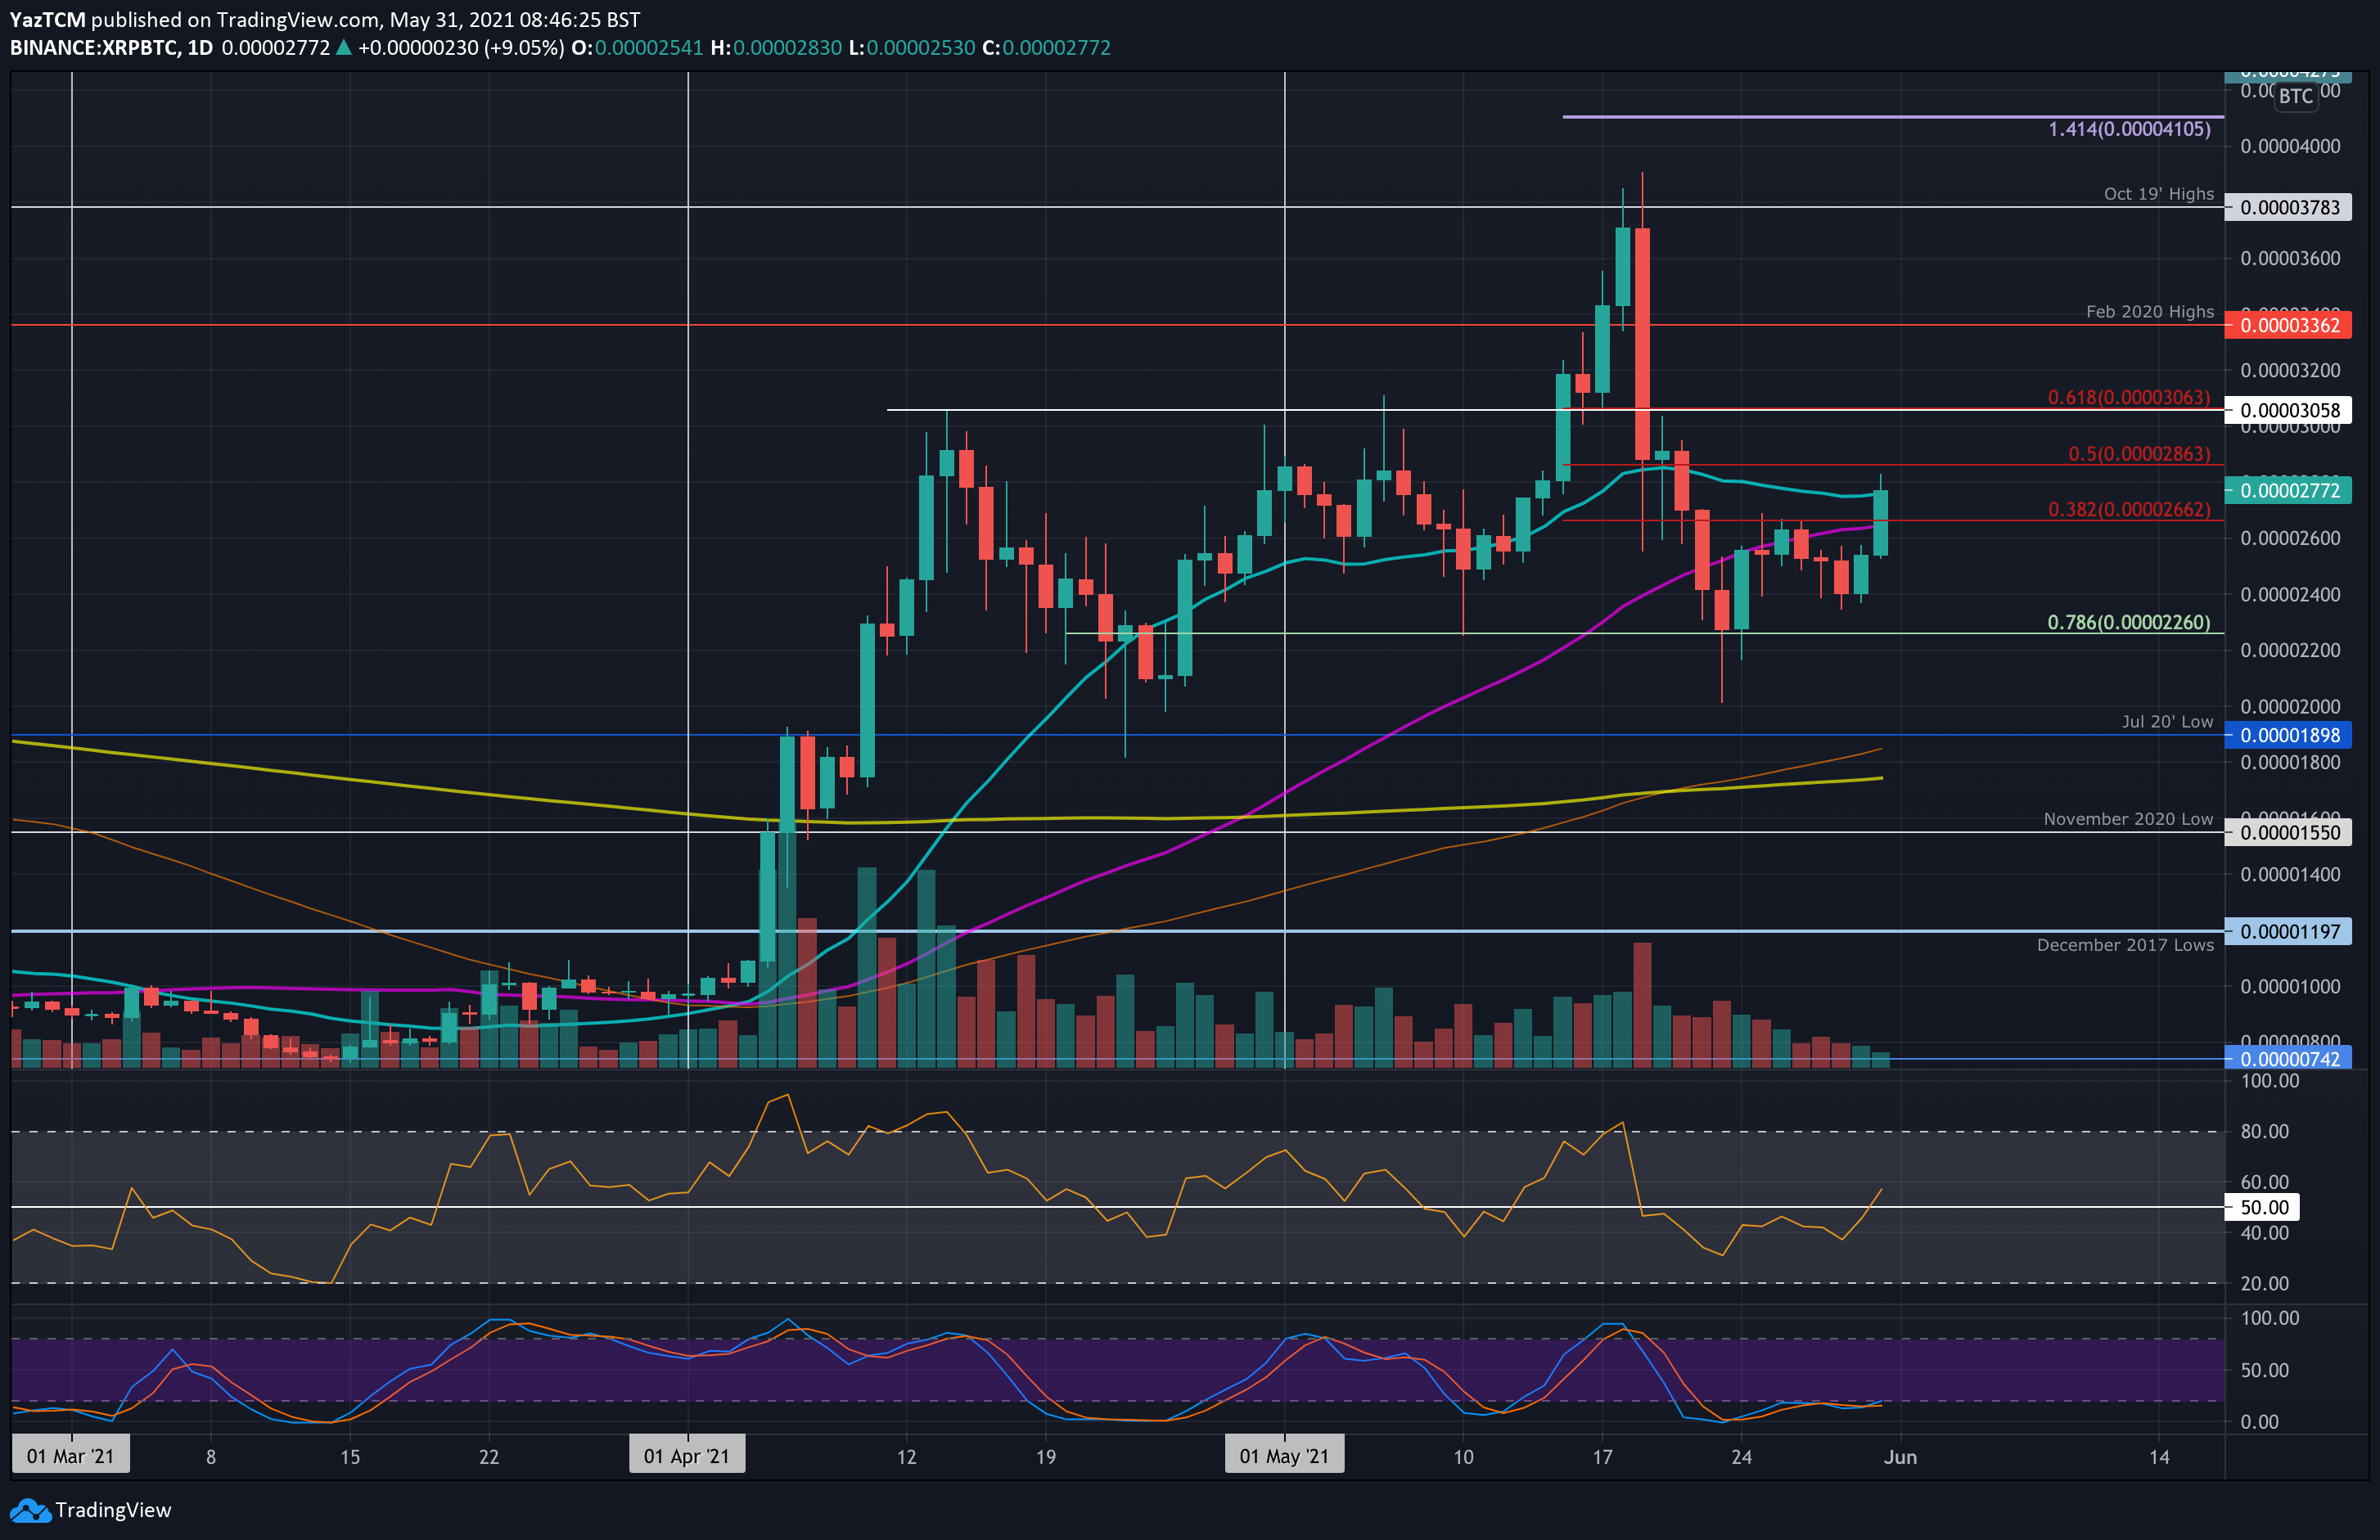
Key Support Levels: 2660 SAT, 2400 SAT, 2260 SAT.
Key Resistance Levels: 2772 SAT, 2863 SAT, 3000 SAT.
XRP managed to break the resistance at 2662 SAT (bearish .382 Fib) that stalled the market recovery last week. It had reversed from this level last Wednesday and started to head lower as it fell beneath the 50-day MA.
Over the weekend, XRP found support at 2400 SAT and rebounded from there. Today, the push higher allowed it to break resistance at 2662 SAT, climb above the 50-day MA, and reach the current resistance at 2772 SAT (20-day MA).

XRP-BTC Short Term Price Prediction
Looking ahead, the first resistance lies at 2772 SAT (20-day MA). Above this, resistance lies at 2863 SAT (bearish .5 Fib), 3000 SAT (bearish .618 Fib), and 3362 SAT (Feb 2020 highs).
On the other side, the first support lies at 2660 SAT (50-day MA). This is followed by 2400 SAT, 2260 SAT (.786 Fib), and 2000 SAT.
The RSI managed to break the midline here, indicating the bulls have taken control of the market momentum for the first time since the market capitulation the week before last.
from CryptoPotato https://ift.tt/34w7gv4
0 Megjegyzések